

What metrics to track in a mobile store
Table of contents
 04-09-26Read Time: 11 min
A mobile application for an online store provides many opportunities, but does not guarantee automatic growth in profits. To understand how effectively an in-app store is working, you need to analyze its performance indicators. Analytics helps to assess user behavior, identify weaknesses, and make decisions based on real numbers. Metrics allow you to learn everything about customer actions – what motivates customers to make purchases, at what stages they exit the application, how often they return, which products they prefer, how long sessions last, etc. Regular monitoring of metrics helps to optimize the interface, increase conversion, improve offer personalization, allocate advertising budget more effectively, and work on improving financial indicators.
Why it is important to analyze application metrics for an online store
Identifying weak spots in the sales funnel
Metrics help you identify where users are most likely to abandon your app. People may browse products but not add them to their cart, or they may abandon the order form at the last step. This analysis allows you to quickly identify problem areas and eliminate the causes of lost potential customers.
Optimization of advertising costs
Metrics show which advertising channels and campaigns bring the most downloads, sales, repeat purchases. This allows you to correctly allocate the advertising budget, close ineffective campaigns, and invest more in effective channels. This approach helps to increase the return on investment in marketing and get more profit within the planned budget.
Improving user experience
Analysis of behavioral factors and technical indicators makes it clear how comfortable users are in a mobile application. Real figures on loading speed, session duration, abandoned carts allow you to respond in a timely manner to negative changes in user behavior. Thanks to this, you can constantly improve the application, increase customer satisfaction, and reduce audience churn.
Building a permanent audience
Customer acquisition and retention metrics help improve loyalty programs, personalize communication, use push notifications more effectively, and actively encourage customers to return for new purchases. A base of regular loyal customers is formed, who place repeat orders and ensure stable growth in the online store’s revenue.
Strategic business decisions
Proper analytics transforms large data sets into useful practical insights. Metrics allow you to accurately assess the real state of sales through the application, forecast revenues, determine development priorities and make strategic decisions. A mobile online store operates with fewer risks – it can quickly predict, identify and quickly eliminate critical problems.
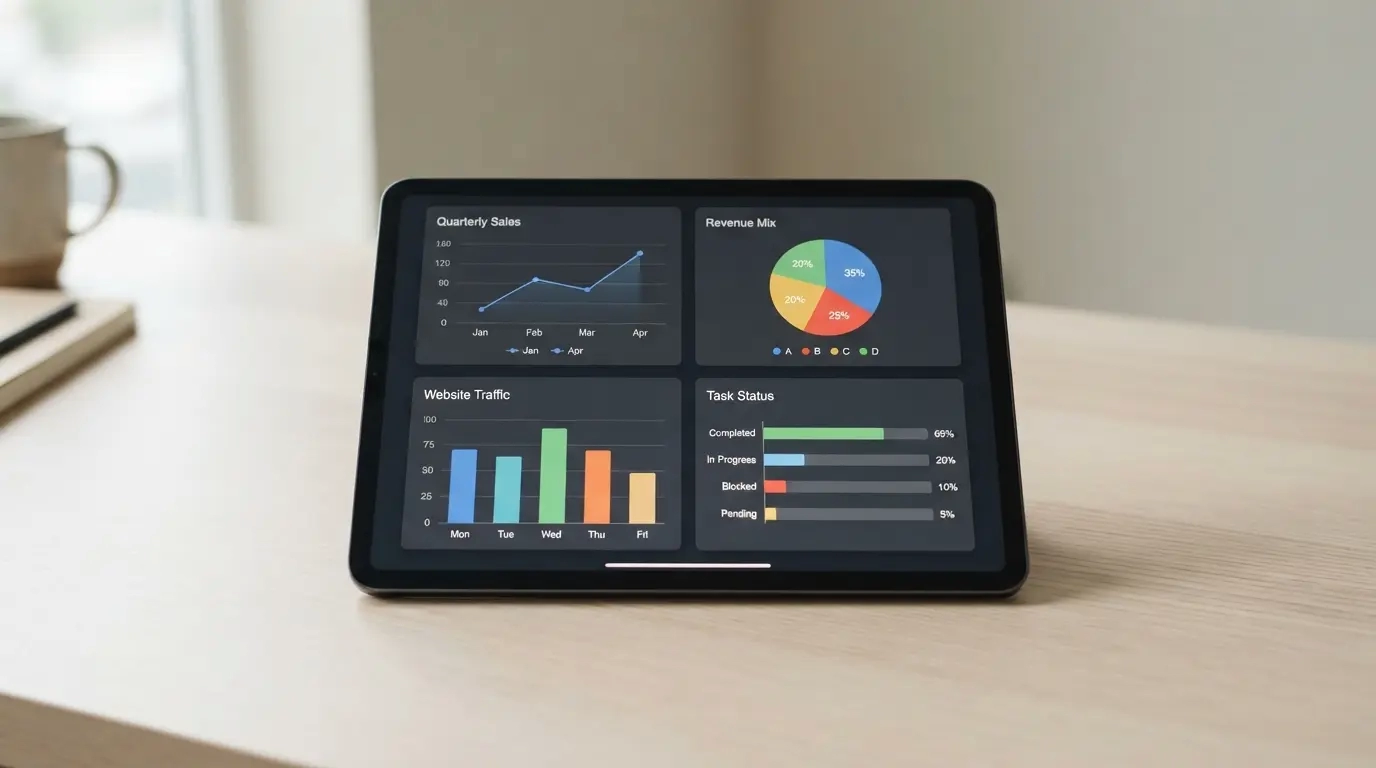
Mobile online store metric groups
For convenience, metrics can be divided into several groups:
- App installation metrics – number of installations, cost per new user, installation sources, percentage of successful registrations, etc. These metrics help to assess the real conversions of advertising campaigns, the effectiveness of traffic sources, and the results of various marketing activities.
- Behavioral metrics – launch frequency, session duration, product views, search and filter usage, adding products to cart, user retention and return, and other metrics. Behavioral metrics help you assess the level of audience engagement and find the stages at which users stop interacting with the app.
- Sales and conversion metrics – conversion at different stages of the funnel, average check, number of orders, revenue, repeat purchases, abandoned carts, financial indicators. Metrics show how effectively the mobile application generates sales and how it affects the profitability of the business.
- Technical indicators – startup speed, loading time, errors, freezes, integration stability, overall performance. These indicators allow you to monitor the quality of work and performance of the store, quickly identify problems, and minimize the loss of users due to technical malfunctions.
- Custom Event Metrics – a collection of metrics that are created individually for a specific project. Custom Events extend standard analytics and allow you to track metrics that are important for a specific business, analyze audience behavior more deeply, and determine which real actions affect conversion and sales.
App install metrics
New user acquisition metrics help you understand whether marketing campaigns are working, which promotion channels bring the most downloads, whether there are any difficulties when opening the app for the first time, and whether ASO page optimization is working correctly.
- Number of downloads . The basic metric shows how many times an app has been downloaded from the App Store or Google Play. This metric alone is not indicative of the success of the store, so it should be analyzed with other metrics of user engagement and retention.
- Percentage of successful registrations. A low rate may indicate an overly complex registration form, many unnecessary fields, technical errors, or shortcomings in advertising campaigns.
- App Install Cost (CPI). The metric shows how much it costs to acquire a new user through paid advertising channels. If this indicator increases, you need to review advertising creatives, select new audiences, and work with promotion channels.
- Download sources. Analyzing installation sources allows you to determine where new users come from and which promotion channels give the best results (organic search, advertising, social networks, newsletters, QR codes, website, referral links, etc.).
User activity metrics
It is important to assess how actively users interact with the mobile application, how often they visit and make purchases.
- DAU, WAU, MAU . The DAU (Daily Active Users), WAU (Weekly Active Users) and MAU (Monthly Active Users) metrics reflect the number of unique users during the day, week and month, respectively. Analyzing these indicators allows you to assess the dynamics of audience growth, the popularity of the application, and the effectiveness of advertising campaigns.
- Average session duration. If users spend a lot of time in the app, this may indicate high engagement or, conversely, difficulties in finding products or usability issues. Therefore, this indicator should be analyzed together with behavioral factors and conversion.
- Stickiness. Calculated as the ratio of DAU/MAU and shows how often users log into the application. A high level of Stickiness indicates good audience engagement, an effective loyalty program, the right personalized recommendations, and motivating content.
Audience retention metrics
It is much more expensive to attract a new user than to retain an existing one. Therefore, audience retention indicators are very important for a mobile store. Metrics help to understand whether users return to the application after the first installation, whether they make repeat purchases, and how effectively remarketing works.
- Retention Rate. The user retention rate shows what percentage of the audience continues to use the application after a certain period of time after installation. A high Retention Rate means that the application forms a base of real store customers who regularly return to search for and purchase new products.
- Churn Rate. Shows what part of the audience stopped using the application over a certain period. The reasons can be different – inconvenient interface, technical errors, slow loading, high prices, lack of necessary products, etc.
- Repeat Purchase Rate. Regular customers form the bulk of an online store’s revenue. The metric shows how often customers return to the store for new orders. A high repeat purchase rate indicates trust in the brand, quality service, and a well-built customer interaction system.
- Push notification effectiveness . It is important to evaluate the number of clicks through push notifications and subsequent user actions – product views, adding to cart, placing orders, repeat purchases. If pop-up messages are ineffective, it is worth reviewing the communication strategy – changing the sending time, personalizing content, segmenting the audience, improving the loyalty program.

Sales metrics
The most important stage of the sales funnel is checkout. It is at this stage that many potential buyers may abandon their purchase due to a complicated checkout process or technical issues. Analyzing relevant metrics helps identify weak points and increase mobile store conversion.
- Conversion . Calculated to estimate the percentage of users who placed an order after viewing a product or adding it to the cart. The view-to-purchase metric allows you to evaluate the effectiveness of product cards – the quality of descriptions, the attractiveness of photos, the price level. Cart conversion analysis helps you understand how easy it is for users to place an order, whether there are any problems with the functionality and interface at this stage.
- Average AOV check. Shows the average amount of each order placed through the mobile application – helps to assess the number of sales and their financial effectiveness. AOV, combined with conversion and the number of orders, demonstrates the real contribution of the application to the online store’s revenue and identifies areas for further optimization of sales in the mobile format.
- Abandoned carts. The metric shows the number of users who left the cart without making a purchase. Analytics helps identify difficulties – a long checkout process, technical problems, hidden fees, irrelevant payment and delivery methods, etc. Personalized push notifications are used to return buyers to abandoned carts.
For deeper analytics, custom events and metrics are created to evaluate them – for example, adding a product to the cart or favorites, clicking on a banner, choosing a delivery or payment method, using a promo code, sending a link to the product in a messenger, etc. Based on such events, custom indicators are formed that directly or indirectly affect the conversion of individual stages of the funnel. This allows you to analyze sales in more detail and determine which user actions directly affect the income of the online store.
Financial metrics
Financial metrics show how much a mobile application affects the profit of an online store, help assess the return on investment in development and marketing, and provide insight into how to properly develop a mobile sales channel.
- Total revenue. This indicator reflects the real contribution of the mobile application to the company’s total sales. Revenue should be analyzed in dynamics and compared with other sales channels – the website, marketplaces, offline stores, and also assess the share of the mobile application in the total business turnover.
- LTV (Lifetime Value). The metric shows the lifetime value of a customer – the projected revenue from one buyer for the entire period of his interaction with the mobile application. This indicator allows you to assess the long-term profitability of the customer base. LTV analysis helps determine the optimal budget for attracting new customers, assess the effectiveness of loyalty programs, forecast future revenue, and segment customers according to their value to the business.
- ROMI (Return on Marketing Investment). The metric shows the effectiveness of marketing investments. ROMI analysis allows you to identify the most profitable advertising channels, optimize the distribution of the advertising budget, abandon ineffective campaigns, and scale the most effective advertising.
Technical metrics
Even effective marketing campaigns and a user-friendly interface will not ensure high sales if the mobile application is unstable. Slow loading, freezing, frequent errors – all this negatively affects the user experience, reduces conversion and increases abandonment. Technical metrics must be monitored in parallel with financial and marketing. Constant monitoring helps to quickly identify problems after updates and maintain high performance 24/7.
- Launch speed. This metric shows the time from the moment the app is opened until it is fully ready to use. Users expect instant launch, so a delay of a few seconds can cause customer loss.
- Screen loading speed . It is important to monitor the speed of opening the catalog, product cards, cart, order form, personal account, settings and other pages. Regular monitoring helps to identify bottlenecks in the application and optimize its operation in a timely manner.
- Crash Rate. Displays the percentage of user sessions that ended in a crash. An increase in this indicator negatively affects the rating in the App Store and Google Play, worsens the user experience, and reduces trust in the store.
The effectiveness of a mobile store cannot be assessed by one or a few separate indicators. Only a comprehensive analysis of metrics allows you to see the full picture and understand where users come from, how they interact with the application, at what stages they leave the sales funnel, which affects conversion, repeat purchases and business profitability. Evaluating financial, marketing, behavioral and technical metrics helps you make the right decisions and constantly improve your mobile application.
Our KitApp team develops turnkey mobile applications for e-commerce , provides technical support, marketing support, and comprehensive analysis of online store metrics. For consultations and ordering services, contact our specialists via the form on the website.


